 BlogTally
 Dashboard
The Blogtally dashboard is your central hub for monitoring all your websites and campaigns. It provides a comprehensive overview of your content's performance and audience growth across different platforms.
Navigation
The dashboard is organized into four main sections, accessible via the top navigation bar:
- Overview (default view)
- Analytics (See Analytics for more details)
- Campaigns (See Campaigns for more details)
- Insights
Overview Section
The Overview page presents two main modules:
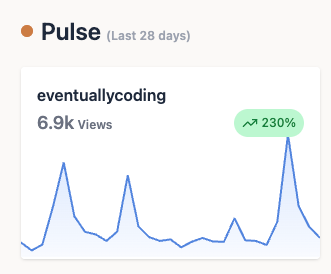
Pulse Module
Displays website performance for the last 28 days, showing:
- Website Cards: For each tracked website, you'll see:
- Total views for the period
- A percentage indicator showing growth compared to the previous period
- A sparkline graph visualizing daily traffic trends
- The website name and current status
- Add a Website Button: Allows you to start tracking a new website
- Click "Add A Website" to begin setup
- Follow the installation instructions to integrate the tracking script
Campaigns Module
Shows newsletter subscription growth over the last 3 months:
- Campaign Cards: For each active campaign, you'll see:
- Total number of new subscribers
- Percentage growth compared to the previous period
- A graph showing subscriber acquisition over time
- Campaign status and name
- Add a Campaign Button: Enables you to create a new newsletter campaign
- Click "Add A Campaign" to start configuration
- Set up your RSS-to-email automation
Module Features
Performance Indicators
- Growth Percentages:
- Green indicators (↗) show positive growth
- Red indicators (↘) show negative growth
- Percentages are calculated by comparing current period with previous period
Graphs
- Sparklines:
- Show daily trends at a glance
- Blue areas indicate the data range
- Helps visualize patterns and spikes in traffic/subscriptions
Time Periods
- Pulse metrics: Last 28 days
- Campaign metrics: Last 3 months
- Comparisons are made against the previous equivalent period
Actions and Navigation
From the dashboard, you can:
- Click on any website card to view detailed analytics
- Click on any campaign card to access campaign settings and stats
- Add new websites or campaigns using the respective "Add" buttons
- Switch between different view modes using the top navigation
Tips for Using the Dashboard
- Regular Monitoring: Check your dashboard daily to spot trends and issues early
- Performance Analysis: Use the growth indicators to identify which content and campaigns are performing best
- Quick Actions: Access all major functions directly from the overview without deep navigation
- Multiple Sites: Monitor all your websites and campaigns in one place for easy comparison
Getting Started
- Add your first website using the "Add A Website" button
- Install the tracking script on your site
- Create a campaign using the "Add A Campaign" button to start growing your newsletter
- Check your dashboard regularly to monitor growth and performance